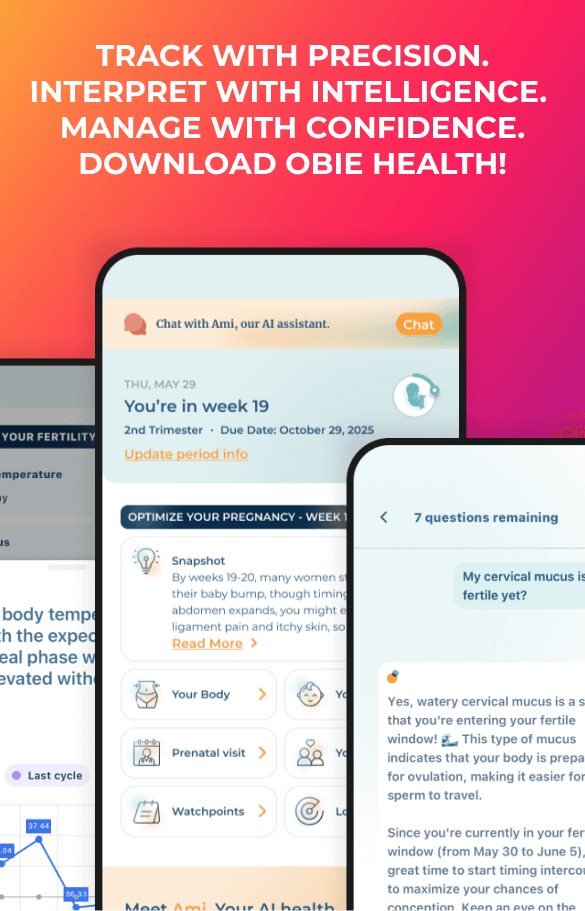
Your basal body temperature BBT is the temperature of your body at rest. For fertility charting, the temperature is always taken in the morning before you move or get out of bed.
Charting your basal body temperature (BBT or BBT chart) helps you learn more about your fertility. Keeping a BBT chart is a very exciting way to get pregnant. It makes you understand your body and often gives getting pregnant and trying to conceive (TTC) more of a purpose.
By charting your basal body temperature (BBT) you can learn more about your fertility and keeping a BBT chart is a very exciting way to get pregnant.
You should start your fertility charting to find out exactly when and if you ovulate and whether you had intercourse at the right time. Fertility or basal body temperature charting is done for several reasons.
Your temperature may go up and stay up above the coverline for 14-16 days after ovulation. That is called a "biphasic curve".
BabyMed is the only fertility site where a real fertility expert looks at your fertility basal body temperature BBT chart and helps you identify ovulation and other information.
A normal human body temperature is on average 98.6 F (37 C) orally. The normal range can be as low as 97.5 and as high as 98.8 F (36.4 to 37.1 C).
You should decide at the beginning of BBT temperature charting what you consider the beginning of a new day, the cycle day 1, either after midnight or when you wake up. Both choices are OK.
Here are instructions to make charting ovulation and your BBT easy.
The coverline is a horizontal line drawn in your basal body temperature
BBT chart after ovulation has been established. It is drawn just above
the last temperature prior to the first rise in temperature.
How long should I chart my BBT before seeing a doctor?
Learn how to start charting your Basal Body Temperature (BBT), improve your chances of getting pregnant and find out if and when you ovulated and if you had intercourse at the right time.
Does it mean that I am pregnant if my bbt temperature goes up in a triphasic curve on 15 DPO?
Chart statistics for BBT charts rated and evaluated from January 1 to October 21, 2002.